
My Wife Beat My Monitoring: Zabbix in Containers Now Watches My Home Network
A Wi-Fi access point stopped answering, and the only one who noticed was my wife. Since then Zabbix 7.0 LTS has been running rootless in Podman containers on my home server and sends a mail when a device goes quiet. The setup, the pitfalls and where to find what in the UI.
🌐 Also available in: Deutsch · Français · Español
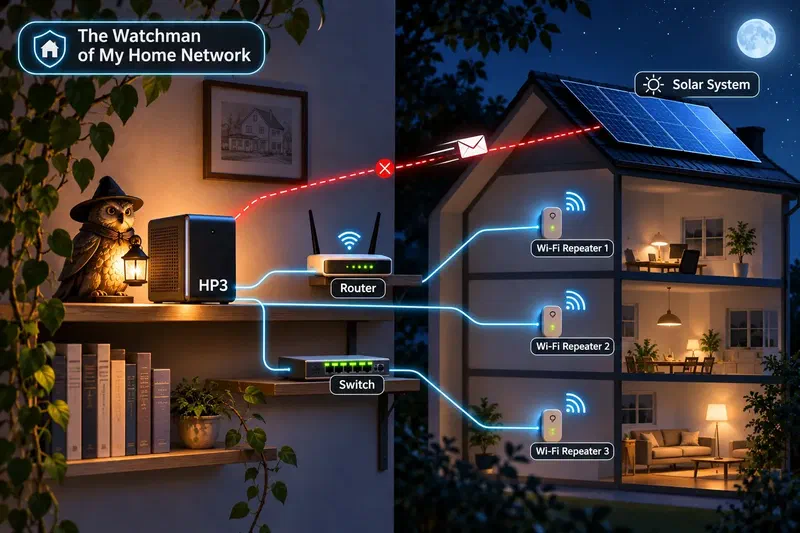
In short: A little over two weeks ago my wife came home and had no Wi-Fi. The access point on the ground floor did not even answer a ping. Power off, power on, and it has been fine ever since. Nobody had noticed apart from her, and that includes my monitoring. Now a Zabbix 7.0 LTS runs in four rootless Podman containers on my NAS server and sends a mail as soon as a component in the home network stops answering. This post covers the setup, what I had to configure on top, where things got stuck and where to find what in the web interface.
Table of Contents
📶 How it started
My wife came home, her phone showed no Wi-Fi, and she was – understandably – not amused. I could confirm it right away: the access point on the ground floor was unreachable, neither through its web interface nor by ping. Pull the plug, wait a few seconds, plug it back in. It has been running without a hiccup for about 14 days now. Why it dropped out I still don’t know. It is one of those things that happens once and refuses to happen again.
What bothered me much more was something else: why did I hear about it from my wife and not from my monitoring? The answer is simple. Prometheus and Grafana watch my servers, and an uptime check tests every five minutes from outside whether the blog and Nextcloud are reachable. Nobody was watching the small boxes in the home network – router, repeaters, switch, phone base station, solar inverter. They have no agent; all you can do is ask whether they answer.
The takeaway: Monitoring covers exactly what you built it for. The gaps are often the inconspicuous devices that simply work – until they don’t.
🔭 What is Zabbix?
Zabbix is open-source monitoring software: it keeps a continuous eye on servers, network devices, applications and services. Alexei Vladishev started it in 2001 as an internal tool, and version 1.0 came out in 2004. Today it is developed by Zabbix SIA in Riga, Latvia. The software is completely free – there is no paid “enterprise edition” with features held back; the company earns its money with support, training and certification. Up to version 6.4 Zabbix was licensed under the GPLv2, since 7.0 under the AGPLv3. An LTS release comes out every year and a half and is maintained for five years.
What Zabbix is known for:
- All in one. Data collection, storage, alert rules, notifications, dashboards, maps and reports come in one product with one web interface. With Prometheus and Grafana these are several tools you put together yourself.
- With and without an agent. The Zabbix agent (these days mostly Agent 2, written in Go and extensible with plugins) measures operating systems and applications from the inside. For devices you cannot install anything on, there are agentless checks: ping, TCP ports, HTTP, SNMP, IPMI, SSH and more.
- Networks and SNMP. Zabbix is especially widespread when it comes to switches, routers, firewalls, UPS units and printers. Ready-made templates exist for countless devices.
- Templates and automatic discovery. A template bundles checks, alerts and graphs. With low-level discovery Zabbix finds out by itself which file systems, network cards or disks a device has and creates the matching checks.
- Large environments. Proxies spread monitoring across many sites; Zabbix is built for tens of thousands of devices.
- A complete API. Everything the interface can do also works via JSON-RPC – I set up the whole configuration for this post with a script against the API.
Where you meet Zabbix: at internet service providers and telcos, in data centers, at banks, public authorities and universities, in many mid-sized IT departments – wherever a mixed landscape of servers, network gear and special devices has to be watched from one place.
The flip side: Zabbix is powerful, and the interface shows it. The configuration lives in the database rather than in text files, which makes “configuration as code” harder than with Prometheus. And the vocabulary – host, item, trigger, template, action – has to sink in once before everything makes sense.
By the way: right after the installation the map on the dashboard showed Riga – that is where Zabbix is based.
The takeaway: Zabbix is the Swiss army knife among monitoring tools. It plays to its strengths especially with many different devices that have no agent of their own.
🎯 The goal and why Zabbix
The requirement was deliberately small: a mail when an internal component stops answering. For devices without an agent that means a ping where the device answers pings, and a TCP connection test on a port such as 80 or 443 where it has a web interface.
A second wish came along: I also want to know when the internet itself is gone – and then get one mail saying “internet unreachable” instead of five separate alerts, one for every external server.
A small script could do that too. I still chose Zabbix, for two reasons. First, Zabbix ships exactly these agentless checks out of the box, plus history, graphs, dependencies between alerts and mail delivery. Second, out of professional interest I want to gain more hands-on experience with Zabbix – build it myself, configure it myself, fall flat on my face myself, instead of just reading about it. The home network is an ideal practice ground: real enough to make sense, small enough that a mistake doesn’t hurt.
I picked Zabbix 7.0 LTS (7.0.32). Version 8.0.0 had just been released, but I don’t need to be first in line for a dot-zero release while I am learning the tool at the same time.
The takeaway: When you learn a new tool, a real, small problem beats a demo. And an LTS release takes one unknown out of the equation.
🧱 The setup: four containers, no root
Zabbix runs on HP3, my NAS server with Debian and ZFS. It is on around the clock anyway and has plenty of headroom (4 cores, 32 GB RAM, more than a third of it free). The setup consists of four containers:
| Container | Job | Memory limit |
|---|---|---|
| PostgreSQL 17 | configuration, measurements, history | 1 GB |
| zabbix-server | runs the checks, evaluates them, sends mail | 768 MB |
| zabbix-web | web interface (nginx + PHP) on port 8080 | 512 MB |
| zabbix-agent2 | measures HP3 itself: CPU, RAM, disks, network | 256 MB |
The key decisions behind it:
- Rootless Podman instead of Docker as root. Everything runs under my normal user, so a mistake in a container does not land on the NAS as root.
- Quadlet instead of Compose. Each container is a small
.containerfile under~/.config/containers/systemd/. Podman turns them into ordinary systemd services – with dependencies, restart on failure and start at boot. For user services to start without anyone logging in, you needloginctl enable-lingeronce. - Host network instead of NAT. With
Network=host, pings and TCP tests go straight into the home network without Podman’s address translation in between. PostgreSQL in turn explicitly listens on127.0.0.1only. - Fixed limits for memory and CPU, so Zabbix never gets in the way of the NAS. In practice all four containers together use about 180 MB.
- No passwords in files. The database password is a Podman secret handed to the containers as a file, and I changed the admin password of the web interface through the API right after the first start.
This is the file for the server:
[Unit]
Description=Zabbix server
Requires=zabbix-db.service
After=zabbix-db.service

[Container]
ContainerName=zabbix-server
Image=docker.io/zabbix/zabbix-server-pgsql:alpine-7.0.32
Network=host
Environment=DB_SERVER_HOST=127.0.0.1 POSTGRES_USER=zabbix POSTGRES_DB=zabbix
Environment=POSTGRES_PASSWORD_FILE=/run/secrets/zabbix-db-pw
Secret=zabbix-db-pw
AddCapability=NET_RAW
PodmanArgs=--memory=768m --cpus=1

[Service]
Restart=always

[Install]
WantedBy=default.target
The takeaway: Quadlet turns containers into plain systemd services. You need no container orchestrator, and systemctl --user status shows everything in one place.
💾 Where does the database go?
An obvious question was whether the database belongs on the system SSD or in the ZFS pool that is really meant for the file shares. I chose the pool. HP3 contains nothing but SSDs, including the three disks in the RAIDZ1 – so speed is no argument against the pool. In return the database survives the loss of one disk there, ZFS detects damaged blocks through checksums, and the directory lives in my home dataset, which the backup PC copies at night anyway. The system SSD has more than 400 GB free, but it is a single disk and not in the backup.
The amounts of data are modest: after the first day the database is under 100 MB. A dedicated ZFS dataset with a block size tuned for PostgreSQL would be cleaner, but it needs root – not worth it at this size.
The takeaway: The fastest disk is not automatically the right one. For a database, redundancy and backup count for more than the last few percent of performance.
📡 What gets monitored
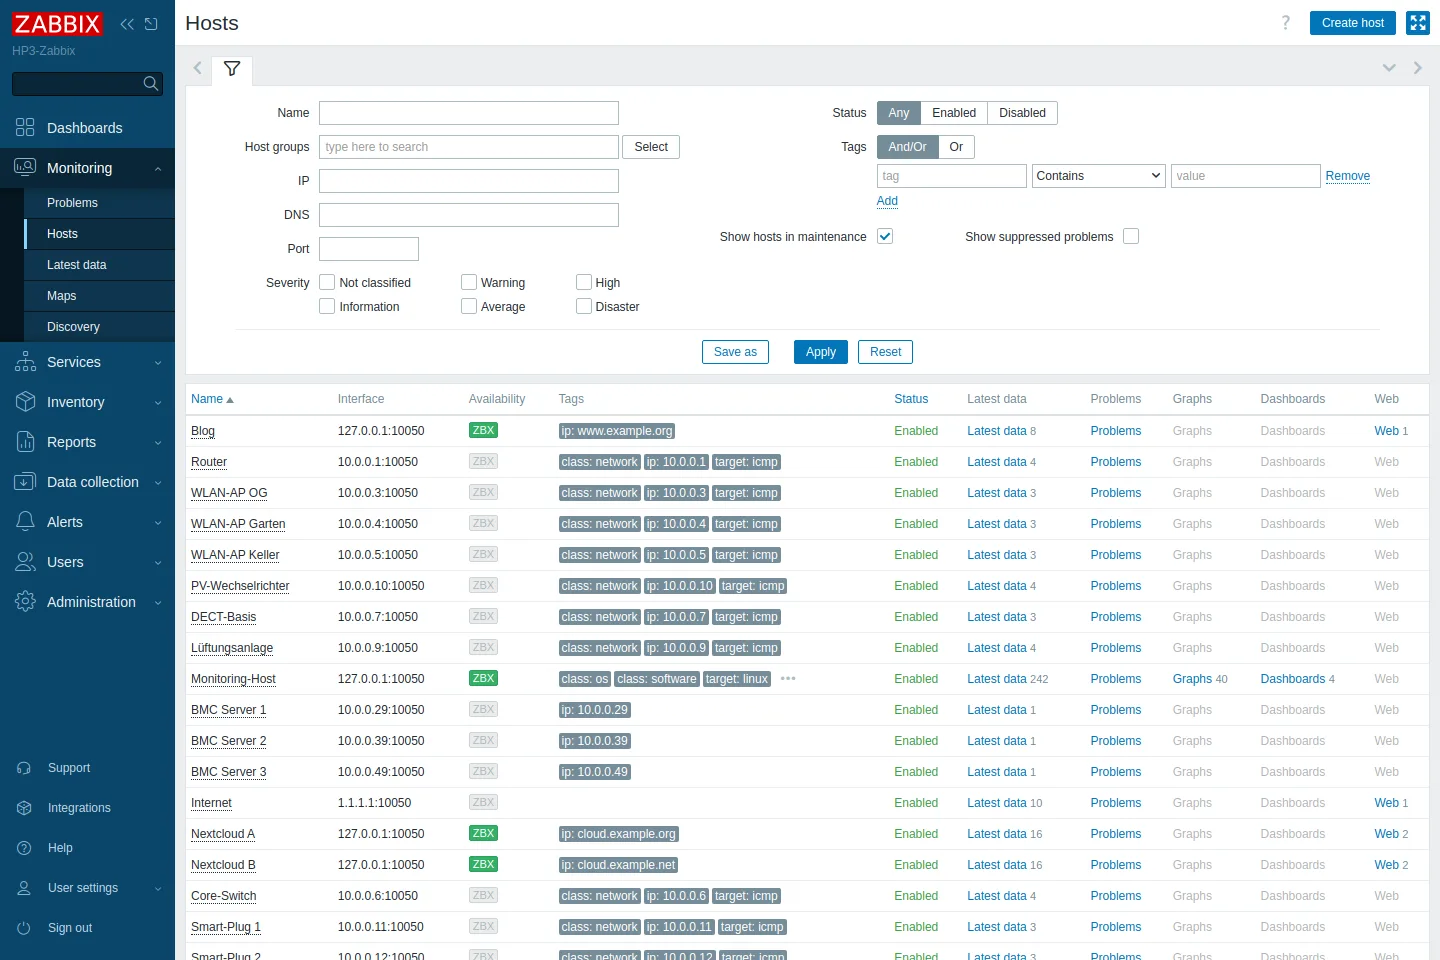
In Zabbix the network is split into two host groups: LAN for the devices in the house and External for my servers in the data center.
In the LAN, Zabbix checks every minute:
- Ping for the router, the three Wi-Fi repeaters, the switch, the phone base station, the ventilation system, the solar inverter and two smart plugs. Zabbix ships the template ICMP Ping for this. It reports a device as unavailable when three pings in a row go unanswered – so after about three minutes. A single lost ping does not raise an alarm.
- A TCP port in addition wherever a web interface runs: 443 on the router and the switch, 80 on the ventilation system and the inverter. The key is
net.tcp.service[tcp,<ip>,<port>], and this alert also fires only after three failed attempts. - Only TCP 443 for the three servers’ remote management controllers (BMC). They sit in the same network, but what matters is whether their interface answers.
A detail I would not have had without Zabbix: the port alert depends on the ping alert. If a device goes down completely, I get one mail (“unavailable by ICMP ping”), not two. Only when the device answers pings but its web interface does not does the port alert speak up.
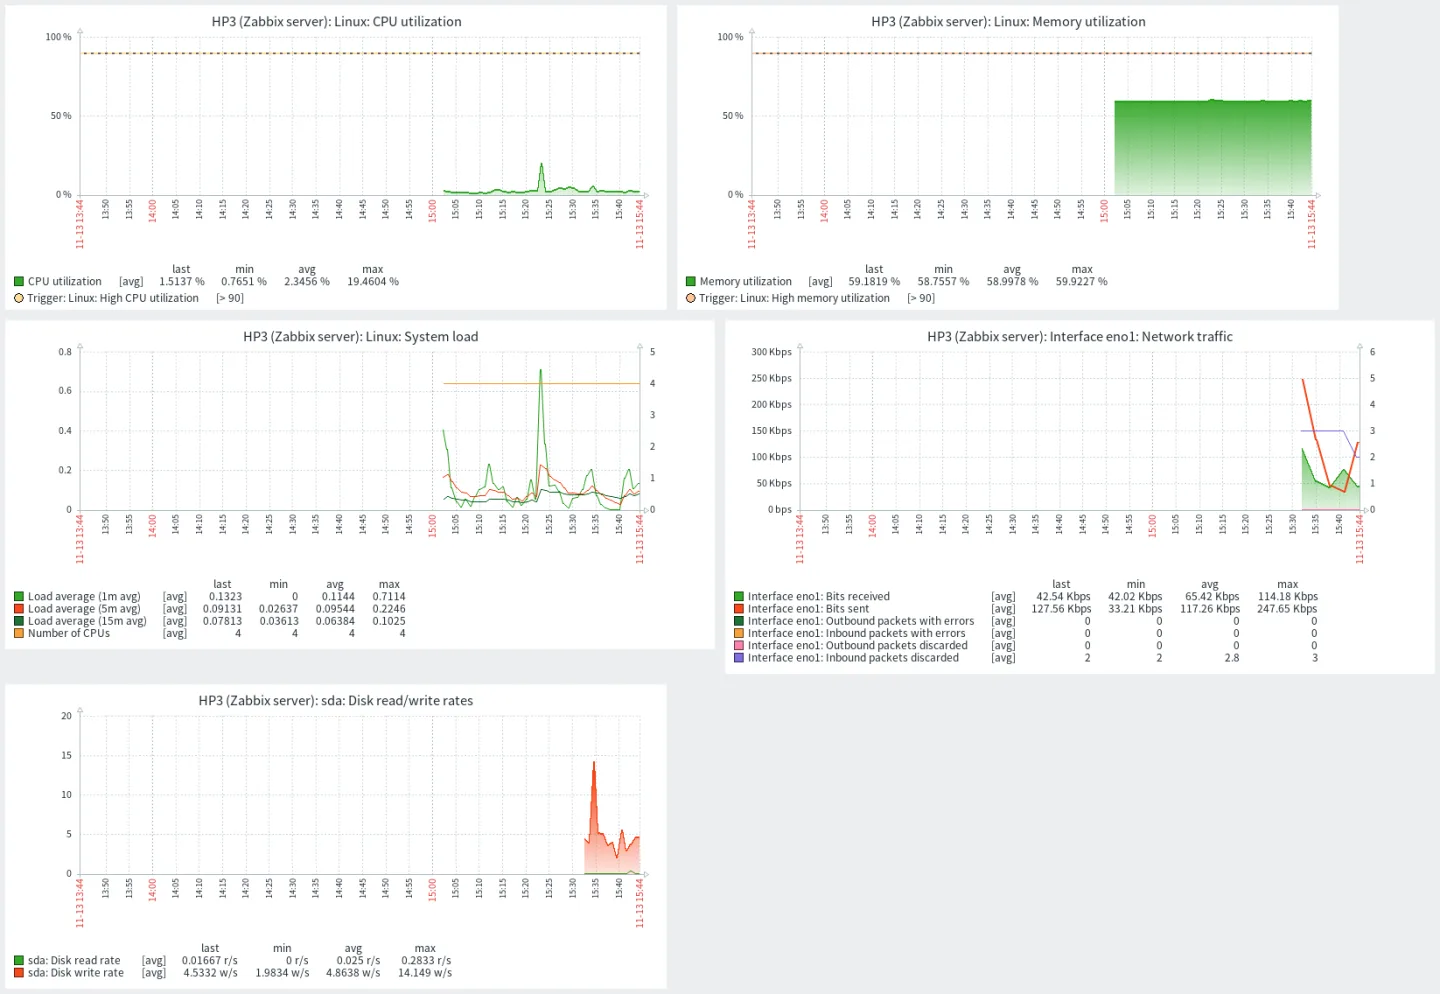
HP3 itself is measured by Agent 2: CPU, RAM, load, swap, processes, every network card, the ZFS datasets and the I/O of the four SSDs. The template Linux by Zabbix agent covers it all, and Zabbix creates the graphs by itself.
The external servers – the blog and two Nextcloud instances – are checked through web scenarios: one request every two minutes, expecting HTTP 200 and a specific piece of content. For the blog it is the end of the front page, for Nextcloud status.php must contain "maintenance":false, for Collabora the WOPI discovery must answer. On top of that the agent reads the TLS certificates every six hours and warns 14 days before they expire.
The internet itself is checked by a separate host called “Internet”: every minute it pings two independent public DNS servers (1.1.1.1 and 9.9.9.9) and fetches https://www.google.com/generate_204, an address meant for exactly this kind of connectivity test that only returns “204 No Content”. The alert “internet unreachable” fires only when both servers stay silent three times in a row – a hiccup at a single provider is not an internet outage. The alerts of the external servers depend on it: if the internet is down, exactly one mail arrives.
What I deliberately do not check on these servers is SSH or open ports. A bare connection to port 22 without logging in ends up in sshd’s log, and fail2ban can turn that into a ban of my own home IP. A quick test of several ports would trigger the firewall’s port scan block. One HTTPS request every two minutes, on the other hand, is a perfectly normal visitor.
The takeaway: Good alerts are frugal. Three failed attempts instead of one and dependencies between alerts make sure a mail actually means something.
🐛 The pitfalls
No setup without surprises. These were the instructive ones:
- Ping didn’t work at all at first. Every ping check ended with
sh: /usr/sbin/fping: Operation not permitted. In the server image,fpingcarries the file capabilitycap_net_raw=ep. If that capability is missing in the container, the kernel refuses to even start the program – not just the ping. The fix was one line:AddCapability=NET_RAWin the server’s Quadlet file. - An exclamation mark in the host name. Zabbix rejects “FRITZ!Box” as a host name. The technical name only allows letters, digits, spaces, dots, underscores and hyphens. That is why Zabbix separates the technical name from the visible name – the second one is what you see everywhere.
- A “free” IP wasn’t free. For the mail test I wanted to simulate an outage and pointed a test device at an address that had not answered during my ping scan. Zabbix then reported 66 % packet loss – something was there after all, it just answered unreliably. For tests I now use an address from the documentation range (192.0.2.1, RFC 5737) that is guaranteed never to answer.
- A fresh Zabbix installation sends no mail. The action that reports problems to the administrators is disabled out of the box, and the admin user has no mail address. Without these two steps everything looks green and still no alert ever arrives.
- The agent in a container does not automatically see the host. CPU, RAM, network and disk statistics come from the host’s kernel anyway. For the file systems I mounted the host’s root read-only under
/hostfsand used a macro to allow only the real file systems; otherwise Podman’s internal overlay mounts show up. The agent only found the disks once the device files/dev/sdato/dev/sddwere visible inside the container – even so, it only reads/proc/diskstats. - Time zone and clock format. The interface was set to UTC and showed “03:26 PM”. Under Administration → General → GUI I set Europe/Berlin and the 24-hour format.
The takeaway: None of the problems were in Zabbix itself. They sat at the seams: container and kernel, test data and reality, defaults and expectations.
✉️ The test: a staged outage
A mail configuration is only proven once a mail arrives. Zabbix uses the same SMTP account HP3 already uses for its status mails (port 587, STARTTLS). For the test I pointed a device at the documentation address and waited:
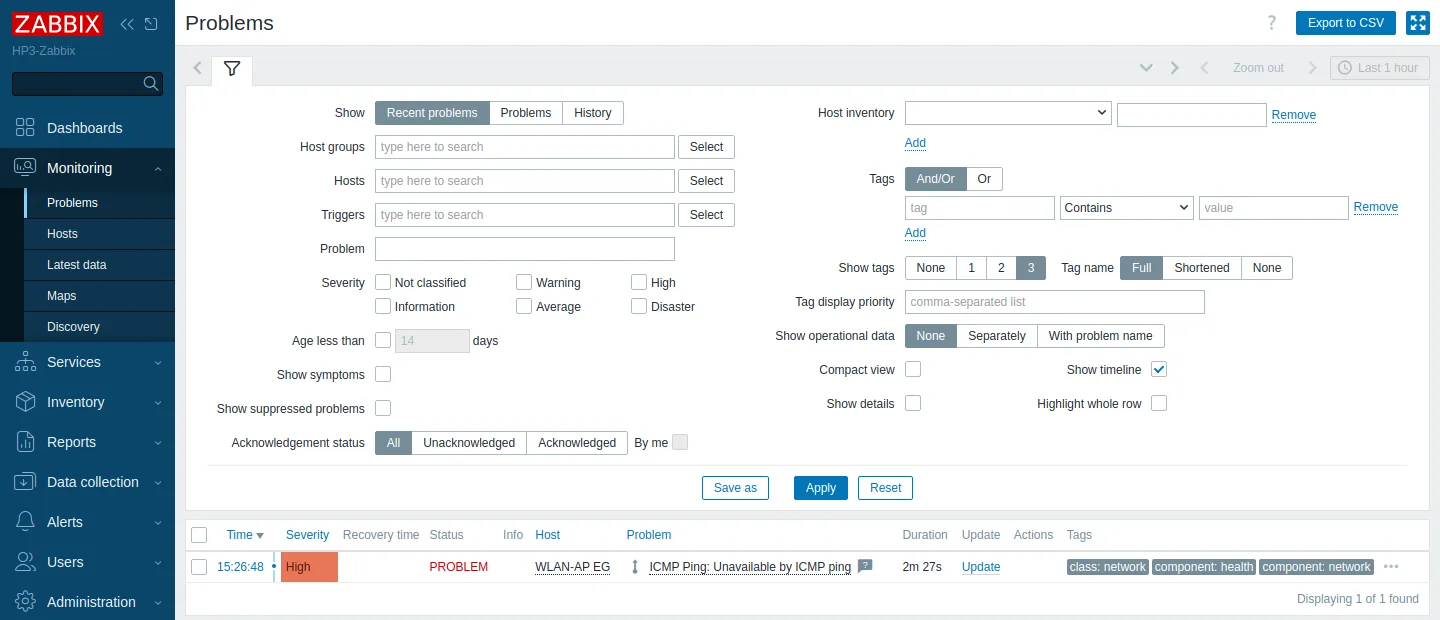
- After about three minutes the mail “Problem: ICMP Ping: Unavailable by ICMP ping” arrived.
- Once I had pointed the address back at a real device, “Resolved in 1m 0s” followed.
I deleted the test device afterwards. For the screenshots in this post I staged the outage once more, with notifications switched off – which is why the failed access point is called “WLAN-AP EG” (ground floor) in the pictures.
The takeaway: An alert that was never tested is an assumption. A deliberately caused outage costs five minutes and proves the whole chain from the ping to the inbox.
🧭 A tour of the interface
Zabbix looks overwhelming at first: the navigation has a good dozen main entries with many sub-pages. For everyday use in a home network, though, you only need a few places. This table is my first-aid kit – below it, each entry explains what you find there.
| I want to … | Menu in Zabbix 7.0 |
|---|---|
| see at a glance whether everything is running | Dashboards → Global view |
| know what is broken right now and acknowledge a problem | Monitoring → Problems (button Update) |
| see when something failed in the past | Monitoring → Problems, filter History |
| check the state of one particular device | Monitoring → Hosts, then Latest data or Graphs |
| see the latest values of all devices | Monitoring → Latest data |
| check whether the blog and Nextcloud answer | Monitoring → Hosts, column Web |
| add a new device | Data collection → Hosts → Create host |
| add a port check to a device | Data collection → Hosts → device → Items and Triggers |
| enter planned downtime (no mails) | Data collection → Maintenance |
| look at ready-made check bundles | Data collection → Templates |
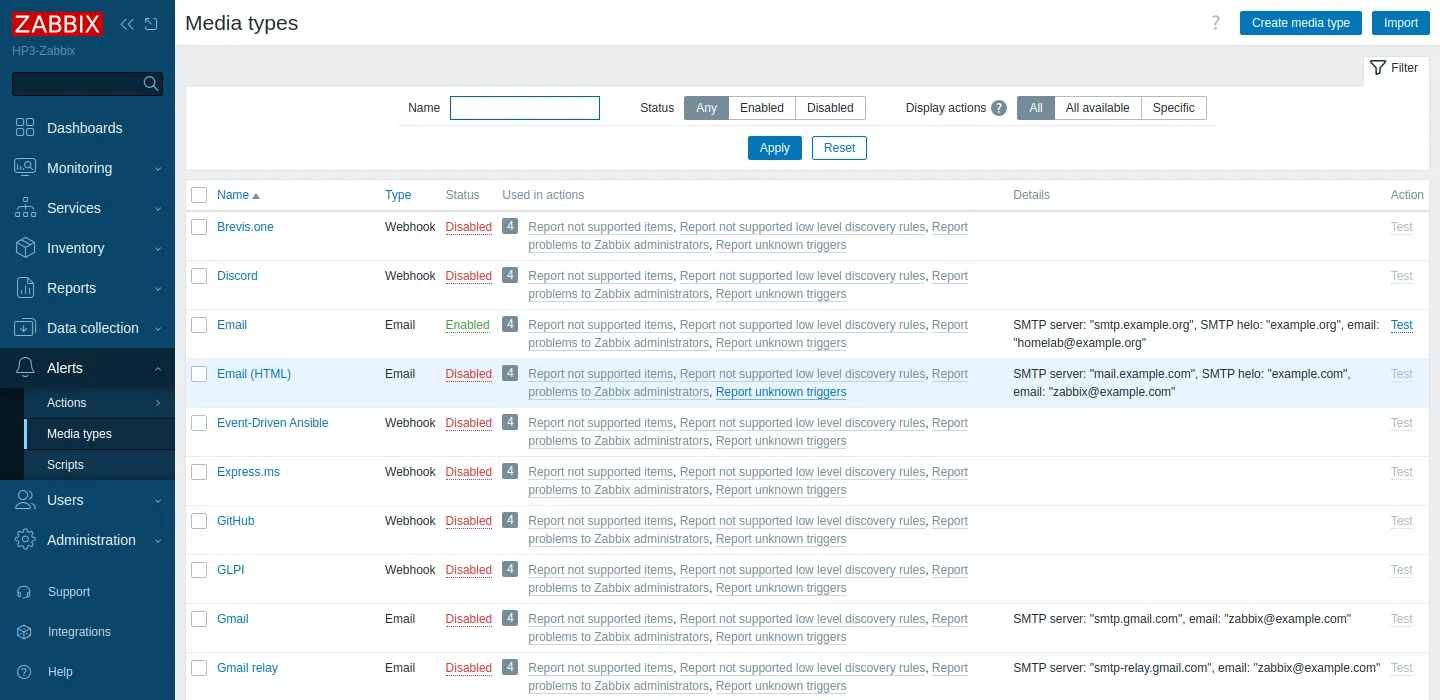
| set up the mail server and send a test mail | Alerts → Media types → Email (link Test) |
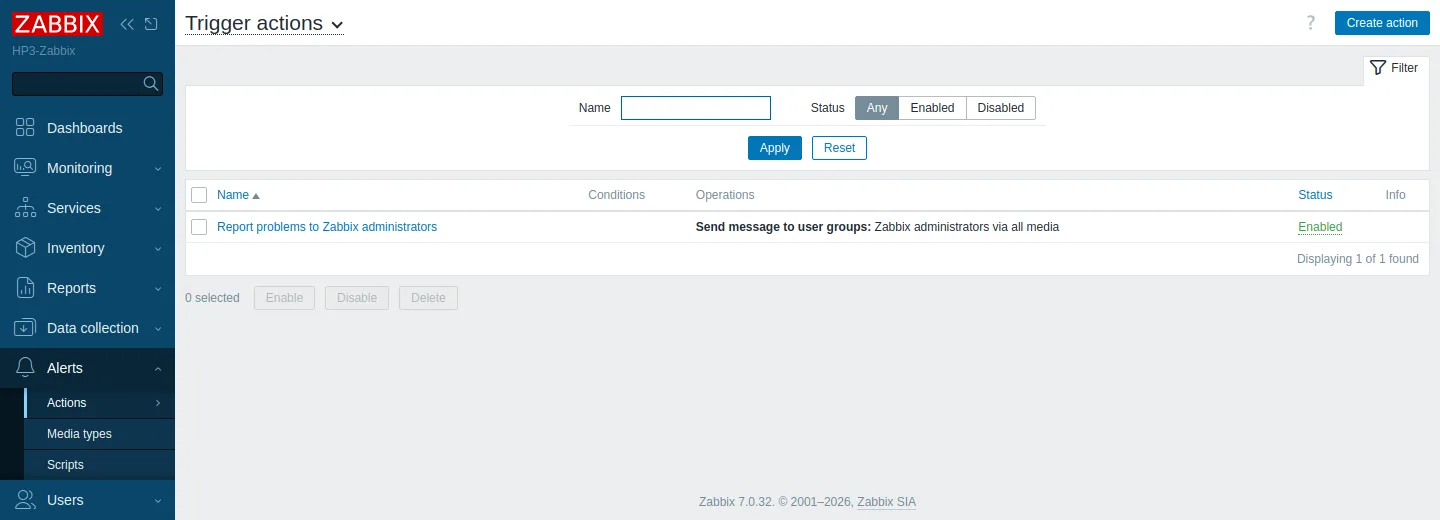
| decide who gets notified about a problem | Alerts → Actions → Trigger actions |
| enter my own mail address | Users → Users → Admin → Media |
| see which mails were sent | Reports → Action log |
| change time zone and language | Administration → General → GUI |
| change my own password | User settings → Profile |
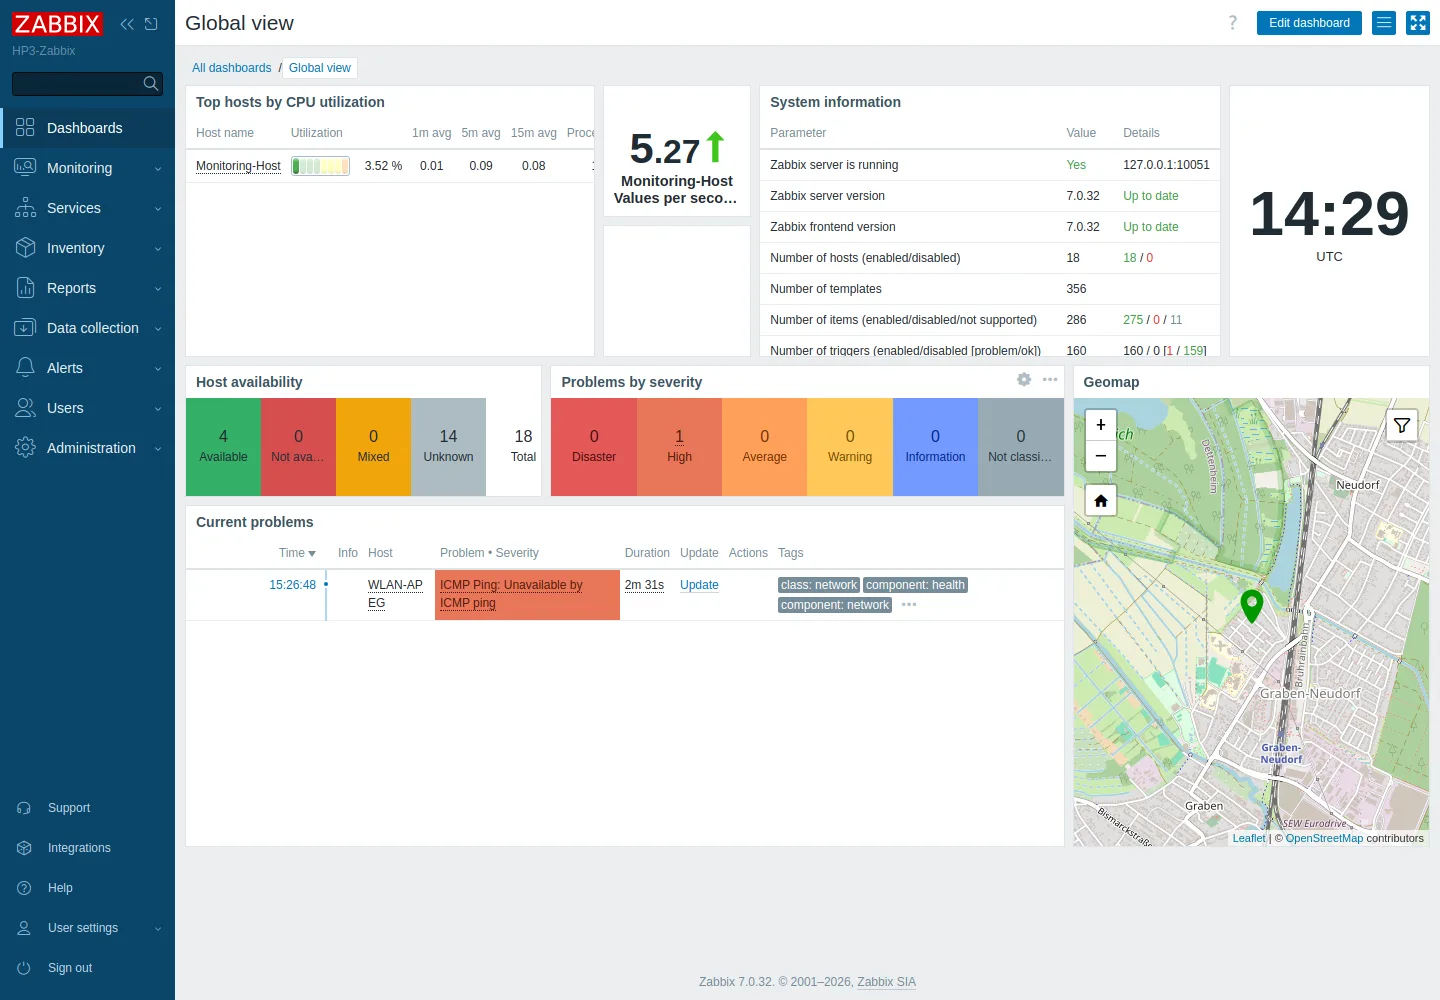
Dashboards → Global view: the overview
The start page shows the availability of all hosts, problems by severity, the current problems and a map. The “Host availability” tile is confusing at first: devices without an agent show up grey as “Unknown”. That is not an error – they simply have no agent; their state lives in the ping and port checks. The map (Geomap) places devices at the location stored in their inventory; I entered the town rather than an exact address.
Monitoring → Problems: what is broken right now
This is the most important page. Every open problem is listed here with its start, duration and severity. With Update you can acknowledge a problem (“I’m on it”) and leave a comment. The History filter also shows resolved problems – handy for finding out later when the access point was last gone.
Monitoring → Hosts and Latest data: the state of each device
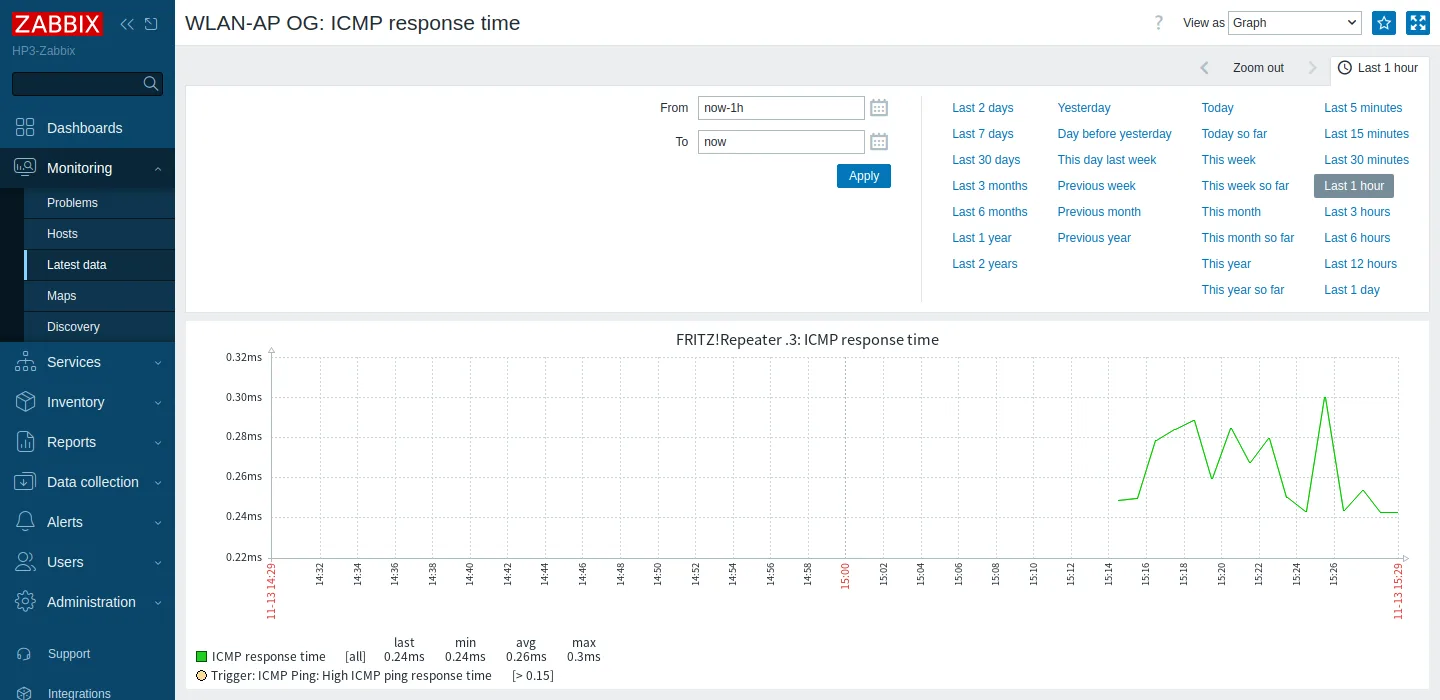
Monitoring → Hosts (picture above in “What gets monitored”) lists every device with links to its latest values, problems, graphs and web scenarios. Latest data shows the raw values: whether the last ping came back, how long it took, whether a port was open. Every value links to a graph.
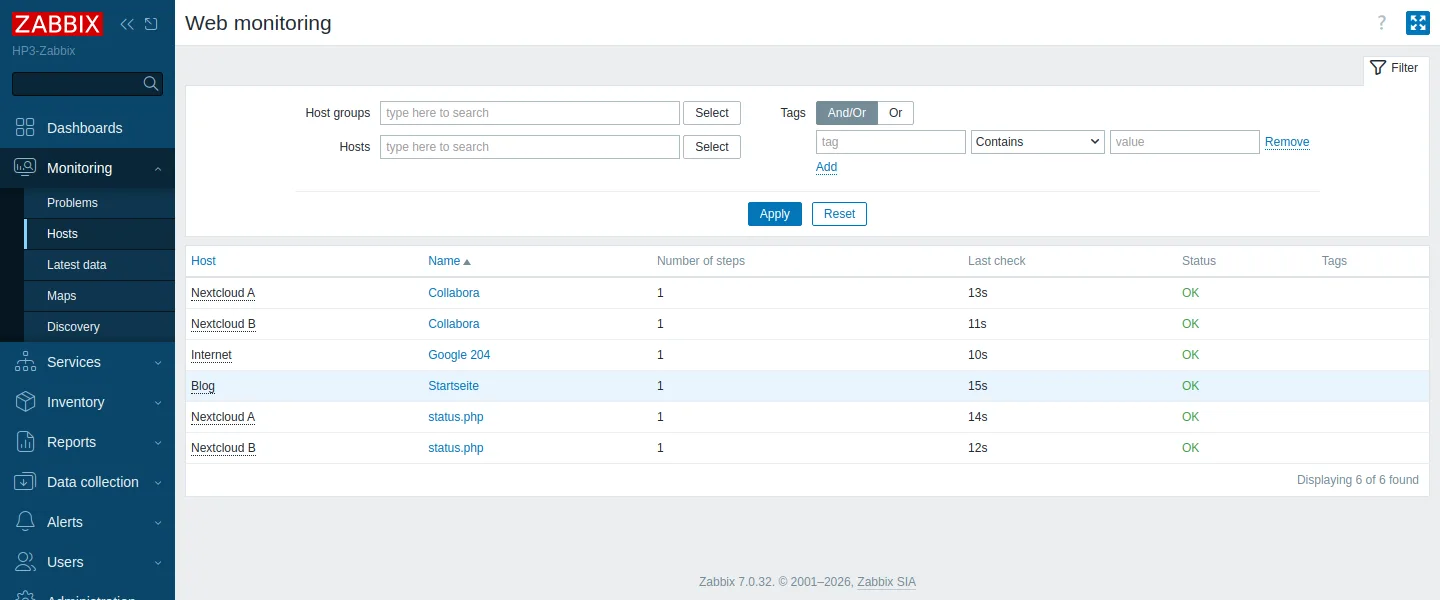
Monitoring → Hosts → Web: the external servers
Zabbix 7.0 has no menu entry of its own for this: in Monitoring → Hosts click the Web link next to a device. This is where the web scenarios for the blog, Nextcloud and Collabora live, with the time and result of the last run. Clicking a name shows response time and download speed over time. If a scenario fails, it tells you which step failed with which error.
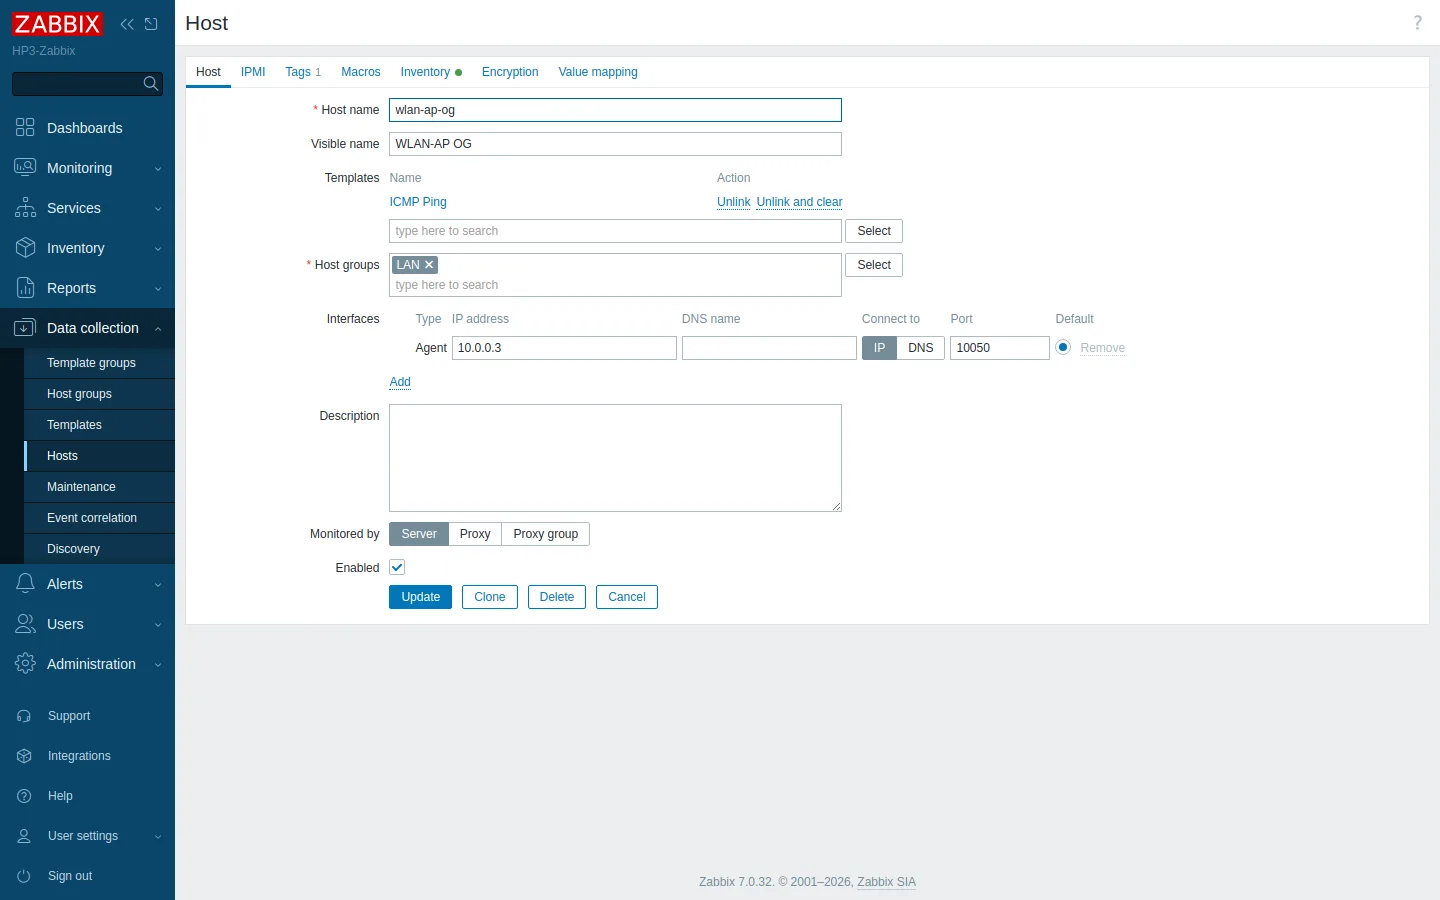
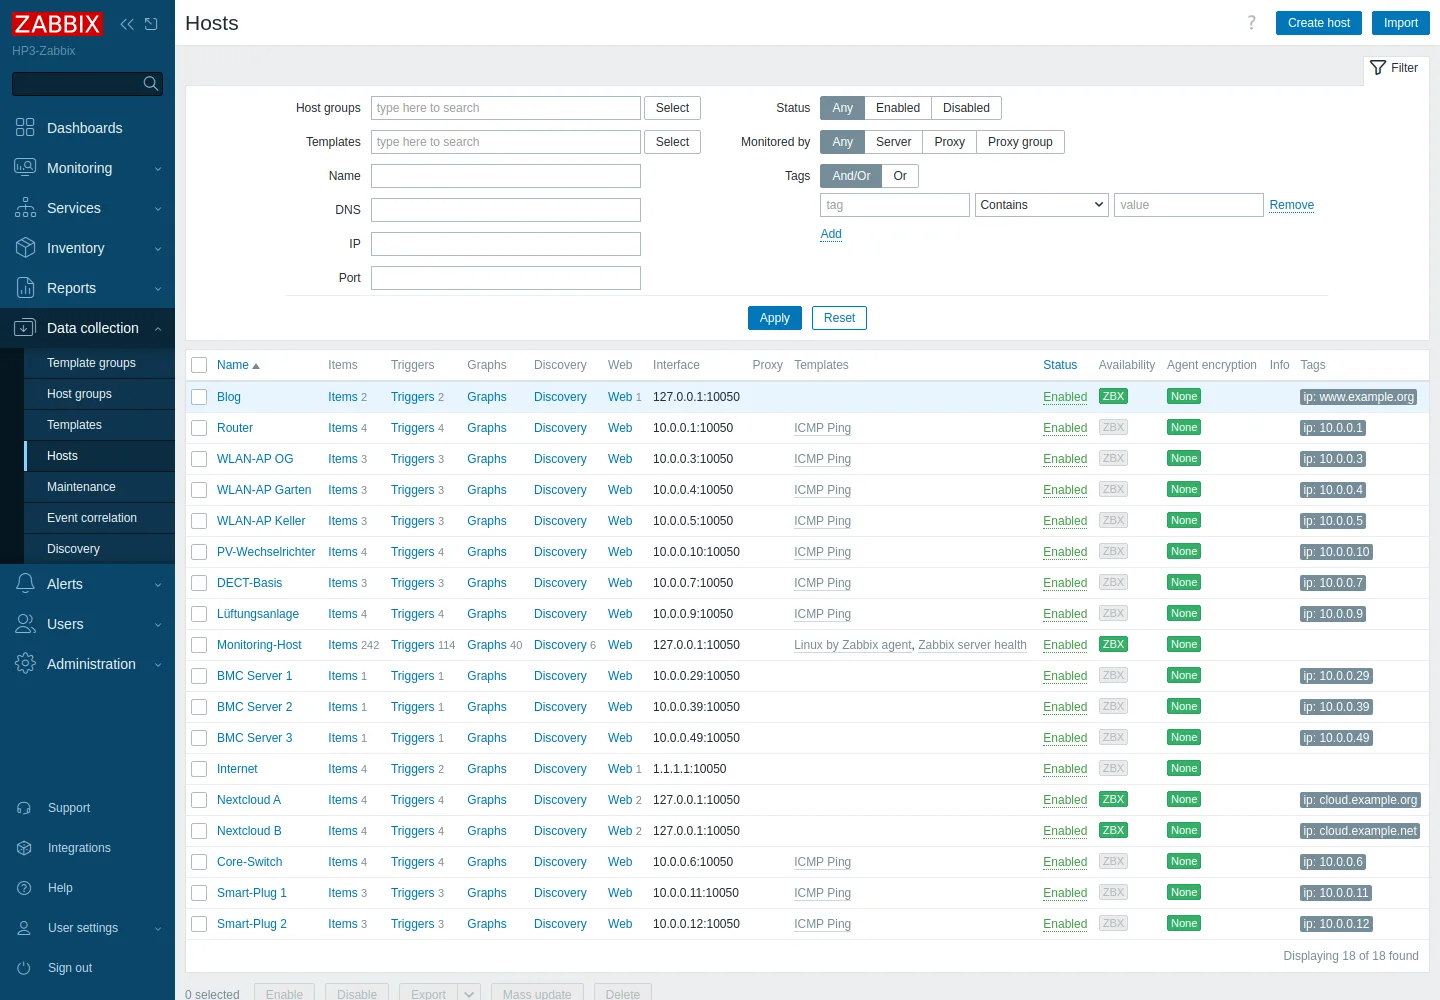
Data collection → Hosts: adding a new device
New devices are added under Data collection → Hosts → Create host. For a device that only needs a ping check, five fields are enough:
- Host name – the technical name, simple characters only.
- Visible name – the name shown everywhere.
- Templates – pick ICMP Ping.
- Host groups – for example LAN.
- Interfaces – one interface with the device’s IP address. The type does not matter for ping; Zabbix takes the address from the interface.
Save, done – the first values arrive within a minute. To check a port as well, add an item of type Simple check with the key net.tcp.service[tcp,,443] under the host’s Items, and an alert such as max(/<host>/net.tcp.service[tcp,,443],#3)=0 under Triggers.
Right next to it is Data collection → Maintenance. That is where you enter times when devices are off on purpose – for example a backup PC that only runs now and then. No mails are sent during those periods.
Alerts → Media types and Actions: getting mail to arrive
Two places decide whether a mail is sent at all:
- Alerts → Media types → Email: SMTP server, port, encryption, sender and credentials. The Test link sends a test mail from here.
- Alerts → Actions → Trigger actions: the existing action Report problems to Zabbix administrators must be Enabled. It defines who is notified about a problem and about the recovery.
Then the recipient: enter your own address under Users → Users → Admin → Media.
HP3 itself: graphs like in Grafana
For HP3, Zabbix built the graphs itself from the Linux template: CPU, memory, load, network per card, usage of every ZFS dataset and disk I/O. You find them under Monitoring → Hosts → Graphs or on the host dashboard Zabbix creates automatically.
The takeaway: Of all the menu entries you need four in everyday use: Problems, Hosts, Latest data and Create host. The rest is configuration you do once.
🔄 What comes next
Some checks now exist twice: my existing uptime check still tests the blog and Nextcloud, and Zabbix does so as well. That is on purpose. Both run in parallel for a few weeks, then I decide whether Zabbix replaces the uptime check. Zabbix has history and response times on its side, the uptime check that it is tiny and hardly anything can go wrong with it.
It was just as important to me that everything can be removed again. Because it all runs rootless under my user, removing it means stopping four services, deleting four files and one directory. I wrote those steps down while setting it up.
So far, Zabbix asks most devices only one thing: “Are you still there?” In the next post it is meant to look inside them:
- FRITZ!Box and repeaters via TR-064. They do not speak SNMP, but this interface reports the state of the internet line, the sync rate and the number of WLAN clients. That is the real gain: an access point can answer pings and still have stopped sending WLAN. “Not a single client for three hours” is the alert that actually helps.
- The switch via SNMP. With the standard MIB (IF-MIB), Zabbix sees the state, errors and traffic of every port and reports when a port goes down.
- The server hardware via iLO. For fans, temperatures, power supplies and disks, Zabbix ships a ready-made template that queries Redfish (HTTP).
- The solar system. The Fronius inverter has its own JSON interface, the Solar API. Zabbix can query it without extra software and draw yield graphs from it.
- Fewer mails during an outage. If the switch fails today, every device behind it sends its own mail. With dependencies between the alerts, Zabbix knows that everything hangs off the switch and reports only the switch.
- A second alert channel such as a push message to my phone (ntfy), in case the mail path itself breaks. Plus shorter retention of the measurements and a nightly database backup.
And honestly, I hope the first real mail from Zabbix takes a long time to arrive.
The takeaway: Running a new tool next to the old one costs little and shows whether it is better in everyday use. Writing down the removal right away takes the risk out of trying.
🎯 The lessons
- Monitoring only sees what you built it for. The silent gaps are the devices without an agent.
- An alert is only proven once a deliberately caused outage lands in the inbox – recovery included.
- Check the defaults: Zabbix has no active mail action out of the box, and the time zone is UTC.
- With containers, problems often sit at the border to the kernel: capabilities, device files, mounts.
- For tests, use addresses that are guaranteed to belong to nobody – “didn’t answer during the scan” does not mean “free”.
🔧 Addendum: less write load for the SSDs
After publishing, the question came up whether constant small writes hurt the RAIDZ made of SSDs. So I measured what the database actually writes: around 750 transactions per minute, a good 110 of which forced an immediate write to disk via fsync – almost two per second. Every fsync stops ZFS from collecting writes in RAM and writing them in batches, and in a RAIDZ every small block lands on the disks together with its parity.
Measured against the SSDs’ lifespan this is harmless: roughly 200 to 300 MB a day is negligible for drives rated at around 1,300 TB of writes each. Since the server sits on a UPS, I still switched PostgreSQL to batching – four options in the database’s Quadlet file:
| Setting | Effect |
|---|---|
synchronous_commit=off | A commit no longer waits for the disk; the transaction log is written in the background |
wal_writer_delay=2000ms | The background process writes only every 2 seconds instead of every 200 ms |
checkpoint_timeout=15min | Checkpoints every 15 instead of every 5 minutes, fewer data pages written twice |
wal_compression=lz4 | The transaction log is compressed |
The result, per minute under comparable load:
| before | after | |
|---|---|---|
forced writes (fsync) | 111 | 30 |
| transaction log | ~80 KB | ~72 KB |
The price: if the power fails despite the UPS, the measurements of the last few seconds may be missing. The database stays consistent – with synchronous_commit=off PostgreSQL only loses the most recent transactions, it never damages older ones. For monitoring data that is a good trade.
The takeaway: Measure first, then optimize. The first setting alone achieved almost nothing; only the measurement showed that the background process kept writing every little change on its own in a 200 ms rhythm.
The screenshots are anonymized: device names, IP addresses, domains and mail addresses were replaced with neutral placeholders before taking them, and the outage is staged.