
A nerdy homelab story featuring Redis, too many databases, and not enough sleep.
📝 Introduction
Congratulations, traveler. If you’re reading this, you’ve decided to monitor your homelab like a responsible adult instead of performing the ancient ritual of “turn it off and on again”.
This post summarizes — at a high, meta, slightly sarcastic nerd-level — how you assemble the full modern Icinga monitoring stack on Debian:
- Icinga 2 – the core engine
- Redis – the lightning-fast event mailbox
- IcingaDB – the shiny new database backend
- MariaDB/PostgreSQL – the long-term memory crystal
- Icinga Web 2 – the visual scrying interface
- Icinga Director – your configuration spellbook
To add to the epicness: today I participated in a full-day online training by NETWAYS from Nuremberg, which continues for the next four days. After a long day of learning, I spent the evening installing Icinga on my homelab server — successfully! Now that everything is running, I’m heading straight to bed. Even monitoring nerds need their uptime.
🧱 Step 1 – Install the Holy Trinity: Icinga 2, Redis & SQL
🔥 Icinga 2 – The Core Daemon
This is the brain of your monitoring stack. It checks things, complains about things, and tells you whether your homelab nodes are UP, DOWN, or in the mystical state of “works on my machine”.
⚡ Redis – The Real-Time Event Warp Drive
Modern Icinga uses Redis as a rapid-fire event transport. All live data (check results, state changes, downtimes, etc.) goes into Redis first because:
SQL is slow. Redis is caffeine on silicon.
🗄️ SQL Database – Long-Term Memory
Your SQL database contains:
- Monitoring history
- Host/service objects
- Events & relationships
In short:
Redis = RAM
SQL = Disk
Icinga 2 = CPU
🔌 Step 2 – Connect Icinga 2 to IcingaDB
IcingaDB is the modern replacement for the old IDO backend. It handles:
- Reading live state from Redis
- Writing structured monitoring data into SQL
- Feeding Icinga Web 2 with consistent objects & history
It needs correct:
- Redis connection (host, port)
- SQL connection (driver, hostname, database, user)
Once configured, IcingaDB becomes the beating heart of your observability pipeline.
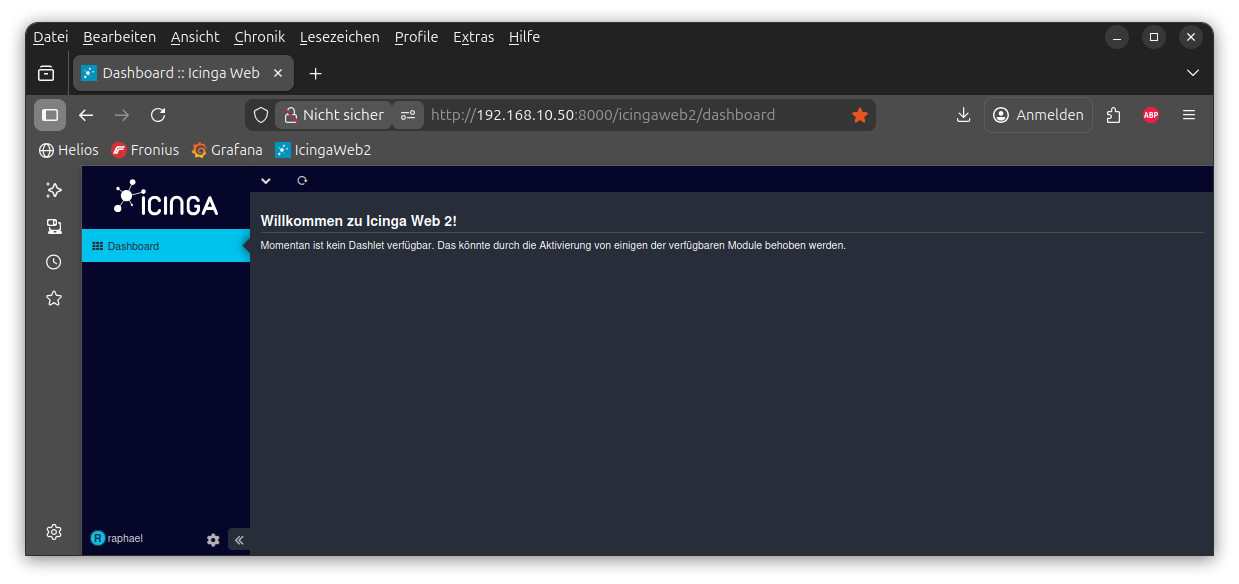
🧙 Step 3 – Summon the Web Interface (Icinga Web 2)
Icinga Web 2 is your dashboard for all things stateful, historical, and occasionally alarming.
It requires:
- A webserver (Apache or nginx)
- PHP with various modules
- A dedicated database for users, groups, roles
Yes: this is not the same database as the one used by IcingaDB. This DB holds only authentication and authorization metadata.
🔐 Step 4 – Activate the Icinga 2 API
The API connects Icinga Web 2 to Icinga 2. You set it up with:
- Internal Icinga CA generation
- Host certificates
- An API user with permissions like:
status/*objects/*actions/*
This is usually the moment you realize you’ve learned more about TLS than any mortal should need to. Welcome to monitoring.
📊 Step 5 – IcingaDB in the Web Interface
In Icinga Web 2, the IcingaDB module serves:
- Live state from Redis
- History from the IcingaDB SQL database
That’s why you configure two separate resources:
- Icinga Web 2 DB → users & groups
- IcingaDB DB → monitoring objects & history
This separation is what makes the whole system scalable and beautiful.
🕹️ Step 6 – Install the Director
The Icinga Director is your web-based configuration automation engine. Instead of writing Icinga DSL files by hand like a caveman, you get:
- Host & service templates
- Apply rules
- Import sources
- Mass deployment
Yes, the Director needs yet another database. This stack is basically Pokémon for DBAs.
🌀 Step 7 – Restart the Universe
The last step is the sysadmin ritual:
- Restart Redis
- Restart IcingaDB
- Restart Icinga 2
- Reload Apache
If everything is correct, Icinga Web 2 will finally show:
- Live host & service states
- Historical data
- Director configuration
If something’s wrong… well, check your logs. They will yell at you in detail.
🌙 A Long Day of Training, a Late Night in the Homelab
Today I participated in a full-day online training session with NETWAYS from Nuremberg. And not just today — this training continues for the next four days.
And like any true nerd, after the training ended, I decided to immediately apply the fresh knowledge and began the installation of the entire Icinga 2 stack on my homelab server.
It took some wrestling with Redis ports, database privileges, and setup wizards, but in the end: the stack is now fully operational.
With that achievement unlocked, I am officially closing this chapter of the evening and heading straight to bed. Even homelab sysadmins need maintenance windows.
🏁 Conclusion
You have successfully assembled:
- Icinga 2
- Redis
- IcingaDB
- Icinga Web 2
- Director
- Three databases and countless configs
Your homelab now has a fully functional observability system — and you may now brag about it on the internet.
We now measure uptime. And our own sanity.