
Right now I’m only running one of my three servers…
thanks to winter season my PV setup isn’t exactly flooding me with power,
so I’ve had to consolidate my workloads a bit. (Kidding… mostly.) ☃️🔋
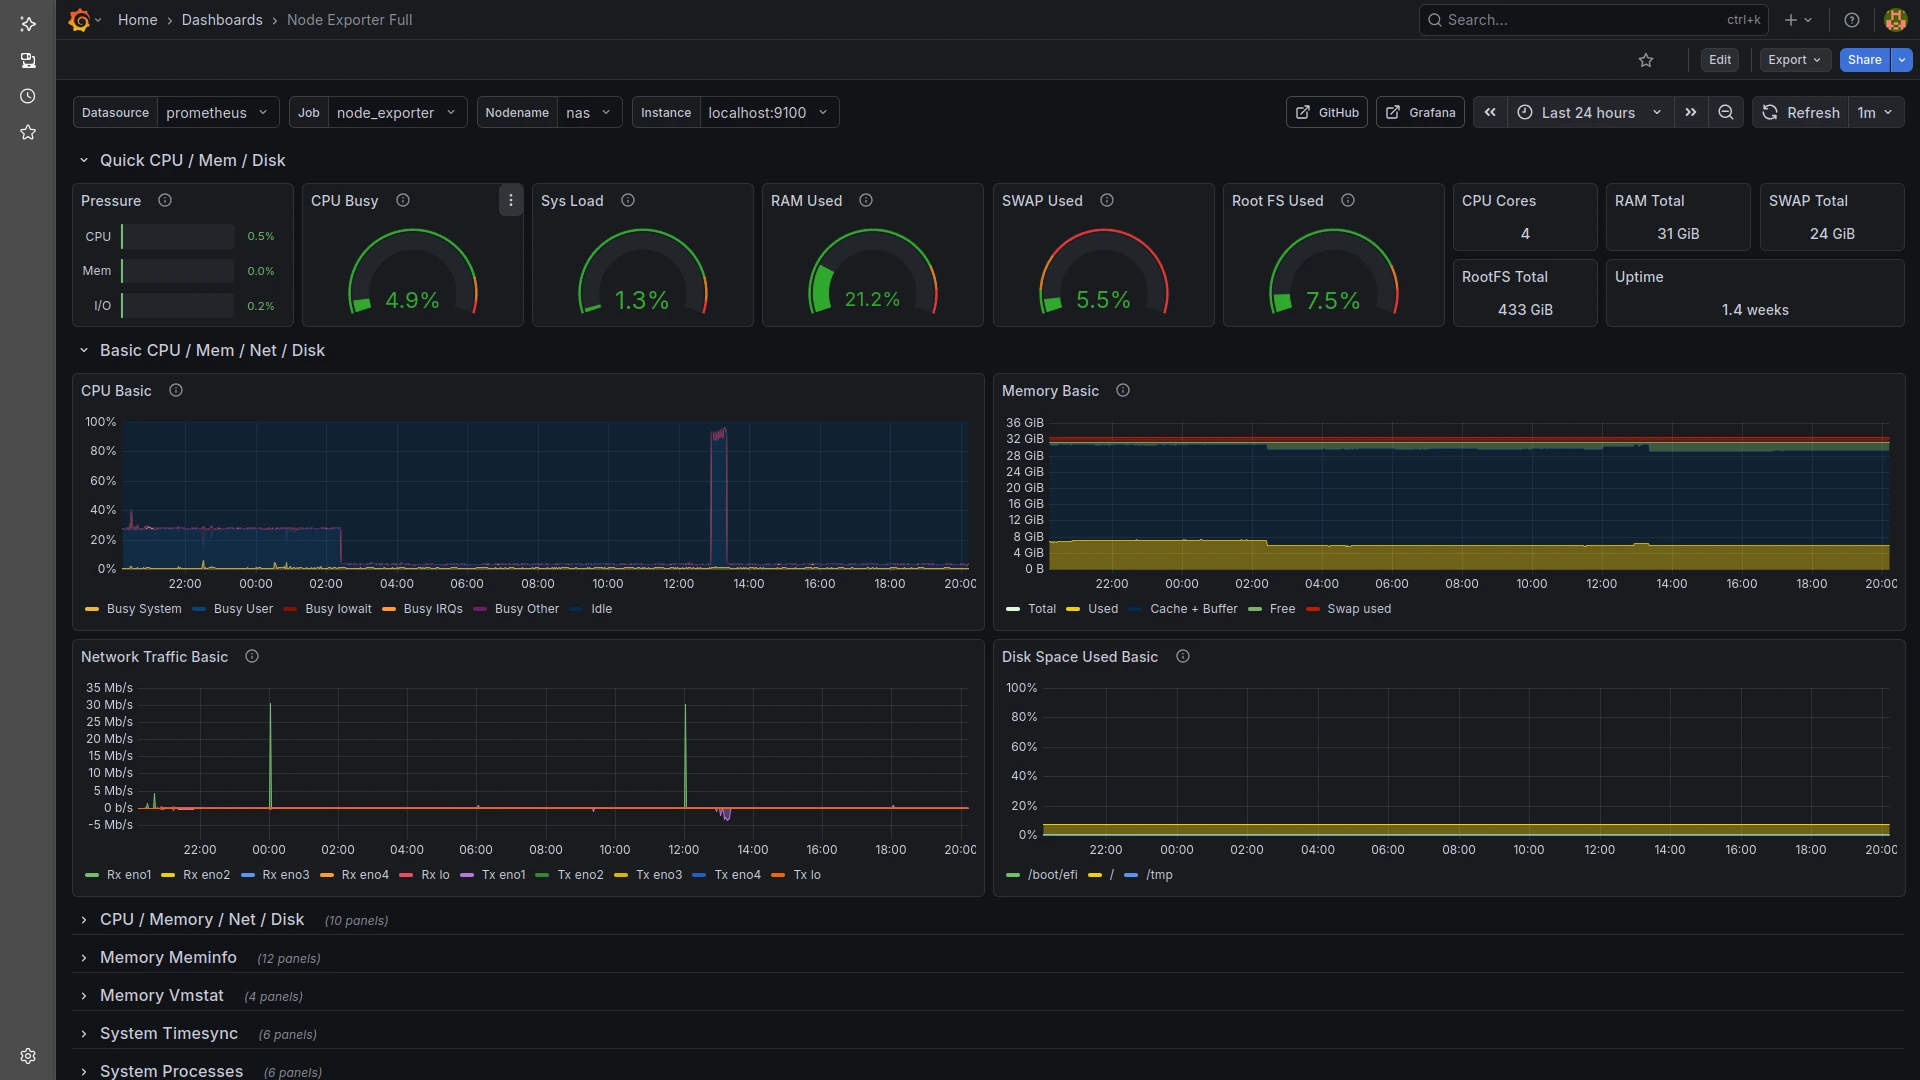
But it is pretty funny watching the whole thing in Grafana,
which I use to monitor the server’s performance.
From the network load you can clearly see the 6-hour backup cycles of the two Nextcloud instances I manage for local clubs.
The high CPU load during the night — up until shortly after 2 a.m. — was simply the antivirus scanner doing its job.
The second big spike around 1 p.m. was my lunch break, when I watched a movie via Jellyfin in the browser.
The browser forces heavy transcoding, meaning the server has to adjust the video quality for the client — especially when subtitles are being “burned in,” which costs quite a bit of CPU.
Now that I’ve installed the Jellyfin Media Player, none of that CPU load happens anymore — the server stays completely relaxed. 🎥⚙️😄
To get proper observability, I also installed Node Exporter, Prometheus and Grafana on the server.
The whole setup took only a few minutes — seriously! ⚡🛠️
Here are the key steps I followed:
- Installed Node Exporter to expose hardware and system metrics.
- Set up Prometheus and added Node Exporter as a scrape target.
- Installed Grafana and connected it to Prometheus as a data source.
- Imported a few prebuilt dashboards to visualize CPU, RAM, disks and network usage.
With these three components running, I have a clean, real-time view of what the machine is doing —
perfect for watching all those tiny spikes and dips that make a sysadmin’s heart happy. ❤️🖥️📊
At the moment I can’t push the system any harder, even though it’s running:
- Jitsi
- GitLab
- my NAS
- a fresh Icinga2 base installation
- Pi-hole
The machine still has a surprising amount of resources left in the tank… 🚀💪