It started with a simple question on a lazy afternoon: how warm are my three servers, actually? The iLO answered instantly: intake air 22 to 25 °C, fans idling at 6 %, everything green. Great. Then the follow-up question: and during the heat wave in July? Silence. The iLO 5 shows temperatures and fans live only. No history, no graph, no “last Tuesday”. So I built one, and it’s on GitHub: aptupgrademe/ilo-thermal. Same workflow as always: I ask the questions and make the calls, my AI co-admin (Claude) reads the iLOs over Redfish, writes the code and double-checks every number it is about to trust. That last part turned out to matter more than expected.
🌡️ First look: which sensor actually means something?
An iLO 5 on a DL20 Gen10 Plus exposes about a dozen temperature sensors. Not all of them are useful, and two of them are lying.
Sensor
HP1
HP2
HP3
Verdict
01-Inlet Ambient
24 °C
25 °C
22 °C
The one that matters: air sucked in at the front
BMC (iLO chip)
69 °C
71 °C
77 °C
Looks scary, isn’t: chip self-heating, limit 110 °C
CPU 1
40 °C
40 °C
40 °C
🤨 identical on all three, at 0 % and 11 % load
AHCI HD Max
40 °C
40 °C
40 °C
🤨 same story
Three servers, different loads, exactly 40 °C everywhere? That smelled like a placeholder, so we cross-checked the disks from Windows via SMART: 31 to 35 °C. The iLO simply can’t read non-HPE drives and fills in a constant. Lesson one: verify a sensor before you build alerting on it.
🗺️ The sensor map: front is y = 1, back is y = 14
The next question was the interesting one: would I even notice a heat build-up behind the rack? These models have no exhaust sensor. But HPE’s Redfish tells you where every sensor sits: Oem.Hpe.LocationXmm and LocationYmm form a grid where y = 1 is the front intake and y = 13–14 the very back. At the back there are two kinds of sensors:
Chip sensors (BMC, LOM network chip): dominated by their own heat, useless for airflow.
Air zone sensors (BMC Zone, PCI 1 Zone): they measure the air around them, with little self-heating. BMC Zone sat at 28 °C on HP2, only 3 °C above its intake. That’s my exhaust stand-in.
And here’s the key insight: the rear temperature alone tells you nothing, because it follows the room. A warm afternoon lifts front and back. What reveals a build-up is the gap. If rear-minus-front grows from its usual +3 °C while the intake and the load stay the same, the hot air isn’t getting out. The second early indicator: fans ramping up although the intake isn’t warmer.
📍 Location, location, location: four degrees from top to bottom
The first hours of history already made one thing obvious: where a server sits in the rack matters more than which server it is. Same room, same rack, same idle load, and yet the intake air differs by several degrees, consistently, every single reading:
Server
Position
Intake (avg)
Range
Rear zone (avg)
HP2 (DL20 Gen10 Plus)
top of the rack
25.9 °C
25–26 °C
28.9 °C
HP1 (DL20 Gen10 Plus)
middle
23.9 °C
23–24 °C
26.9 °C
HP3 (MicroServer Gen10 Plus v2)
near the bottom
21.9 °C
21–22 °C
25.9 °C
33 readings over the first five hours of a quiet evening; all fans at their minimum of 6–8 %. Bottom to top, the intake climbs in clean two-degree steps: 21.9 → 23.9 → 25.9 °C. That’s four degrees between the server near the bottom and the one at the top, with nothing but height in between. The physics is simple: warm air rises. The exhaust of everything below collects at the top of the rack and the top server breathes some of it back in, especially if the rack top is closed or the space above it is tight. Note that the gap from rear to front is the same +3–4 °C on all three machines. The servers themselves behave identically; it’s the air they get that differs. Why that matters:
The top server hits every limit first. On a 30 °C summer afternoon, HP3 would still be comfortable while HP2 is already knocking on the warning threshold. Plan for the warmest seat, not the average.
Compare each server with itself. A fixed “normal” for the whole rack would flag HP2 as permanently suspicious. That’s why the alert rules use each server’s own 7-day median.
Placement is a free tuning knob. Put the machine that runs hottest or matters most at the bottom, close unused rack units with blanking panels so exhaust can’t sneak back to the front, and leave the top of the rack room to breathe.
Confession: I underestimated this. When the servers went into the rack, the placement strategy was, let’s say, “wherever there was a free slot”. Airflow physics didn’t get a vote. If the rack ever gets a redesign, the servers go as far down as possible, stacked together at the bottom where the air is coolest. The top slot, by the way, already has the right tenant: the switch. According to its datasheet it is specified for stable operation at considerably higher ambient temperatures than the servers, so it can live with the warm air up there far better than a ProLiant. The rule of thumb I’m taking away: the warmest seat goes to the device that tolerates heat best, not to whoever arrived last. Harmless in September. But now I know exactly which server to watch in August, and I have the numbers to prove whether a rearranged rack actually helps.
🧰 The script: boring on purpose
ilo_thermal.py is a single Python file, standard library only. No pip, no requests, no matplotlib, nothing to break on the next distro upgrade. Every 10 minutes cron runs it:
Collect: one read-only Redfish GET per iLO for thermal data. The script connects by IP but verifies the TLS certificate against my own root CA and the name on the certificate, because the jump host doesn’t use the AD DNS. Yes, the homelab PKI from an earlier post pays off again.
Store: everything goes into SQLite. Roughly 100–150 MB for three servers and 400 days, a full year for comparison.
Evaluate: the alert rules below.
Report: a single, self-contained HTML file with the charts.
🚨 When does it shout?
Rule
Trigger
Intake limit
≥ 30 °C warning, ≥ 35 °C critical (HPE rates these boxes for 35 °C ambient)
Temperature jump
+4 °C within an hour: dead AC, closed door, a space heater someone “just parked there”
Heat build-up at the rear
rear-minus-front gap ≥ its 7-day median + 5 °C and ≥ 8 °C
Fans without reason
fans 20 points above normal while the intake isn’t warmer: blocked airflow or dust
Sensor unhealthy
any sensor or fan not reporting OK
iLO unreachable
three failed polls in a row
“Normal” is always the server’s own median over the last seven days, so HP2’s warmer spot at the top doesn’t count as an anomaly. It’s HP2’s normal. Those baseline rules only arm themselves after a day of history; a fresh install won’t page you about noise. Alerts are stateful: one mail when it starts, a reminder every 12 hours, and a “resolved” mail at the end. No inbox carpet-bombing.
😴 The collector sleeps, the iLO doesn’t
Here’s the catch: my jump host isn’t on 24/7. Polling only works while it runs, and since the iLO keeps no temperature history, the hours it was off are simply gone. The report shows them honestly as gaps instead of drawing a misleading straight line through the night. But the iLO does keep something: the Integrated Management Log. Every hardware event (overheating, fan failure, power loss, memory or PCIe errors) is stored there with a timestamp, whether anybody is watching or not. So the script remembers the highest EventNumber it has seen per iLO, and an @reboot cron line runs it two minutes after boot. Anything newer gets reported with its original timestamp. To test it, we rewound HP2’s cursor. The script promptly dug up an Uncorrectable PCI Express Error from 23 July that nobody had ever noticed:
IML HP2 CRIT: iLO log 2026-07-23 20:29:31 UTC [PCI Bus]: Uncorrectable PCI Express Error Detected.
              (Segment 0x0, Bus 0x1, Device 0x0, Function 0x2)
A one-off, never repeated, but exactly the kind of thing you want to know about. Two details keep this sane: the first run only sets the cursor, so you don’t get your servers’ entire life story in the first mail. And the IML class Network is ignored by default, because HPE logs every link down as “Critical”, and that happens at every patch reboot. (While digging, the IML also revealed that all three servers lost their network link at the exact same second on 26 September for 90 seconds. That’s not three servers failing, that’s one switch rebooting.)
📈 The report
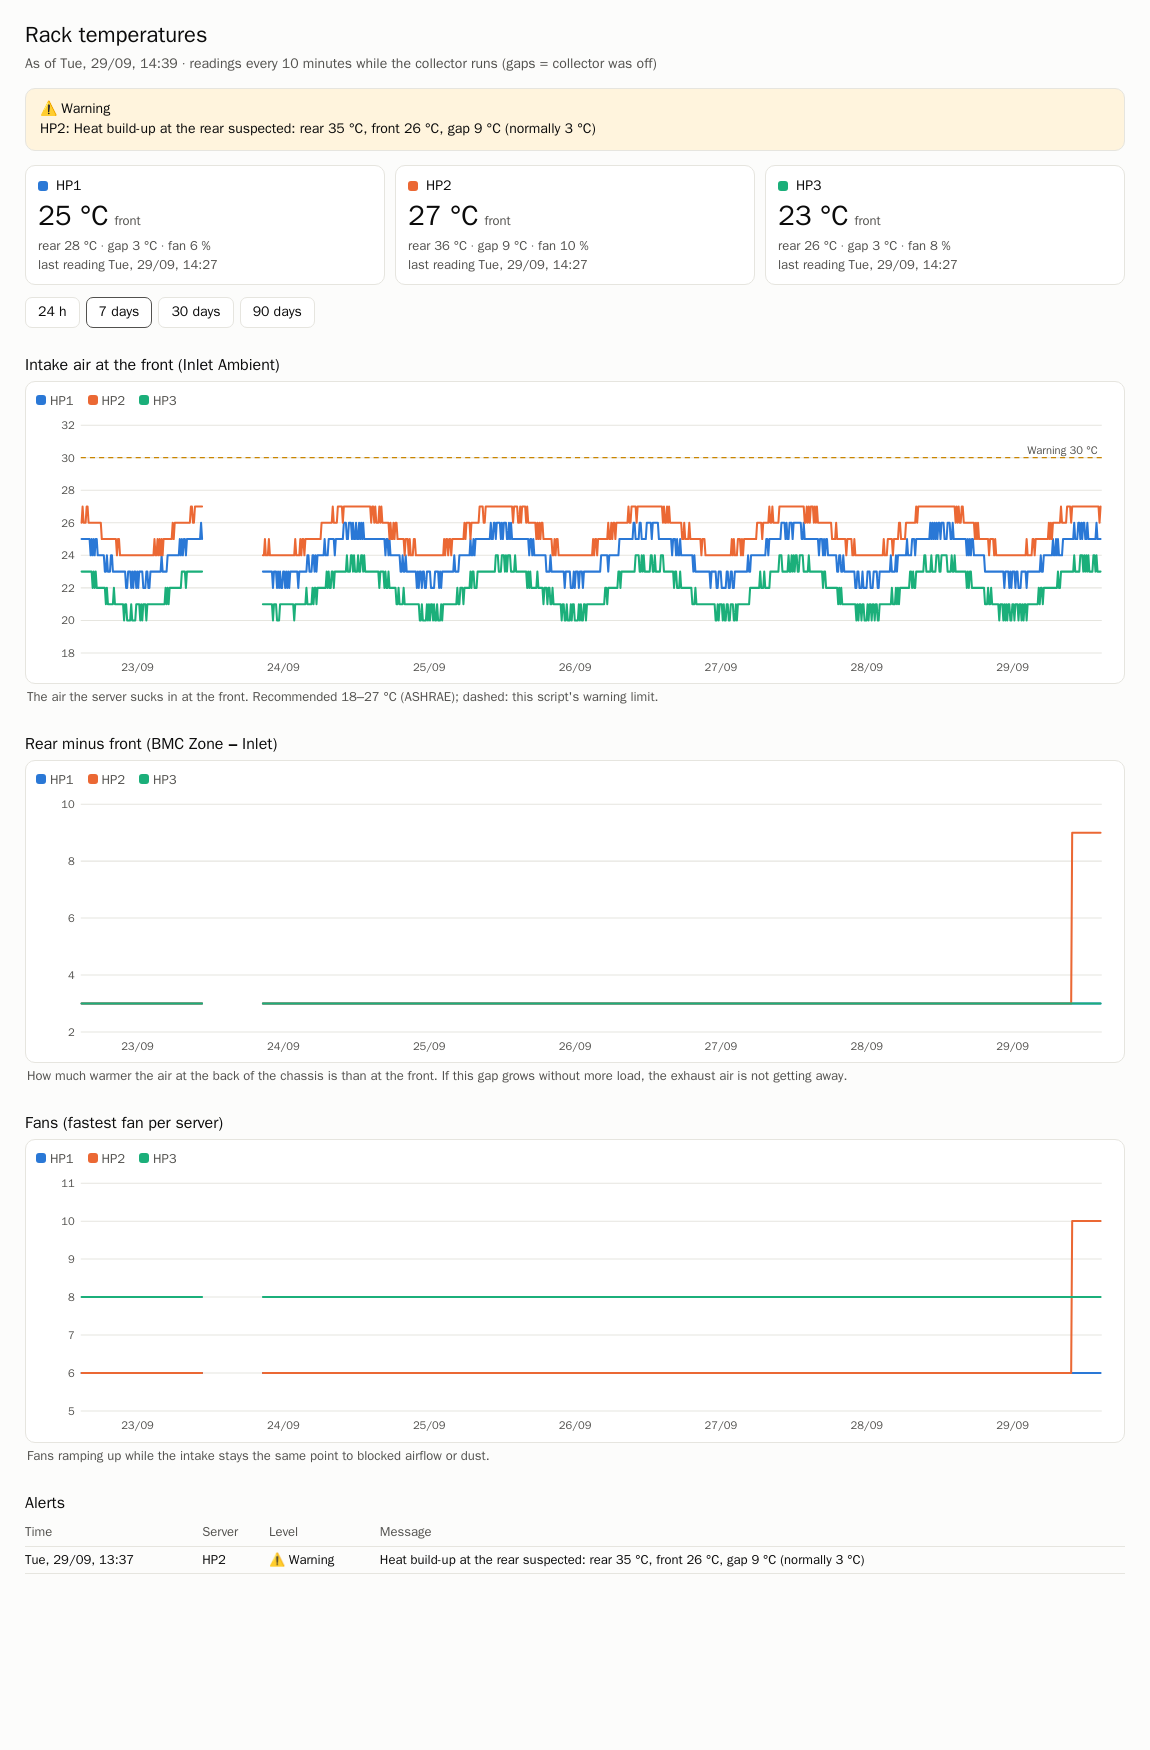
The report with one week of synthetic demo data, including a simulated build-up behind HP2. The real history is just getting started.
Three charts: intake air (with the warning line), rear-minus-front gap, fans. One measure per chart, no dual-axis crimes.
Time ranges 24 h / 7 / 30 / 90 days, hover tooltips with all servers at that moment, gaps where the collector was off.
Status tiles, an alert banner and the alert history, including IML catch-ups.
Light and dark mode, one HTML file, no external dependencies. Open it locally or drop it on a share.
📦 Grab it
Everything is in the repo: github.com/aptupgrademe/ilo-thermal. Full documentation in English, French and Spanish: installation, a read-only iLO account (the Login privilege is all it needs), every config key, every alert rule, troubleshooting, and how to adapt the two sensor-name patterns to other ProLiant models. The report and alerts speak English or German.
This is a hobby project, published as is under the MIT license. I accept no liability for its correct function, for missed or false alerts, or for any damage to hardware, data or anything else resulting from its use. It does not replace your servers’ own thermal protection or a professional monitoring system. Always check the values in the iLO before you act on them. Tested on iLO 5 with DL20 Gen10 Plus and MicroServer Gen10 Plus v2; anything else is up to you.
🎯 Takeaway
The iLO is a fantastic snapshot and a terrible memory. Half an afternoon turned the snapshot into a history, and along the way taught me that two of my sensors report fiction, that the top of the rack is always the warm seat (four degrees warmer, in my case), and that the real exhaust indicator is a difference, not a temperature. Now it’s autumn and everything is boring and green. Next summer, I’ll have a year of data to compare against. That’s the whole point. 🌡️📉